Tracker PMS and Jarvis: A Report Guide
Introduction
The following sections highlight how the modules in Jarvis Analytics populate their data with the data obtained from Tracker PMS. You’ll discover how to compare data from Tracker reports to data from Jarvis so you can better understand how your data is pulled from your PMS and populated in Jarvis. This will allow you to feel confident in Jarvis’ ability to structure and provide valuable insights into trends and recommendations for your business.
Disclaimer
If your office or organization has customized any core metrics (Gross Production, Net Production, Adjustments, Collections, New Patients, or Patient Visits) please contact your Customer Success Manager for a customized report guide. This report guide provides instructions based on the platform’s default metric definitions and calculations.
Summary
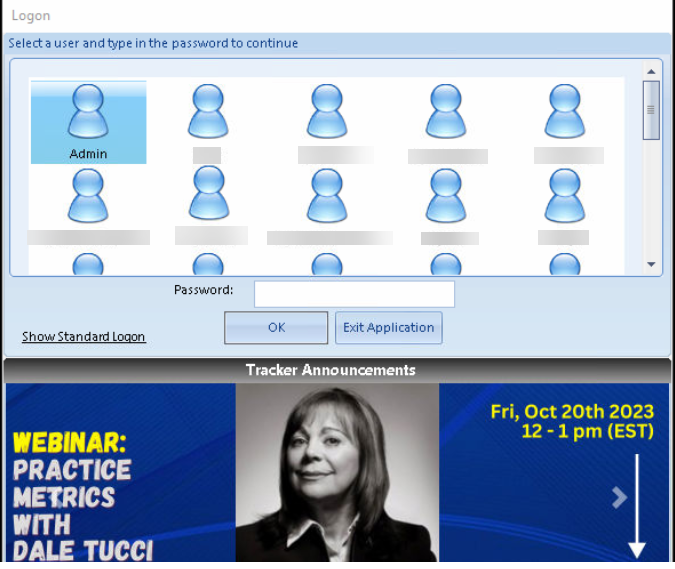
Jarvis Analytics uses four reports from Tracker to generate data for the various modules within. Use this document to pull the proper reports from Tracker and compare how it is being displayed within Jarvis. Let’s get started. Your first step is to make sure you are logged in to the landing page of tracker. Just simply select your icon and enter your password into this screen.
Aging (Aged Receivables)
Tracker does not have credits, so the values for include and exclude credits are the same. Additionally, it uses two reports for the office totals you see in Jarvis Analytics:
- Aged Receivables: For by patient
- Aged Receivables by insurance: For by insurance data
To create the report:
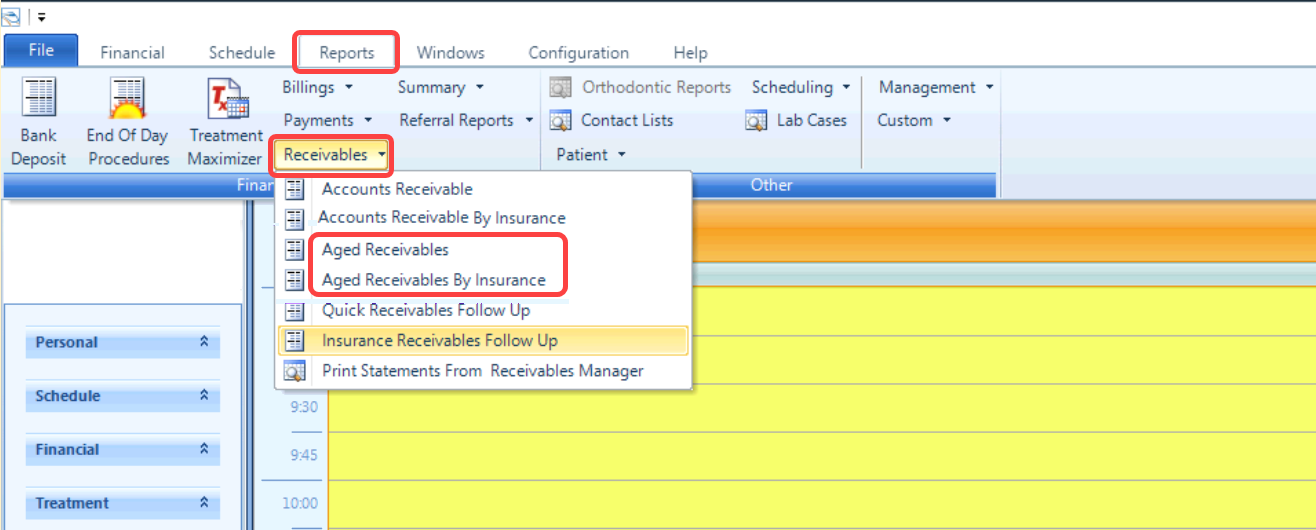
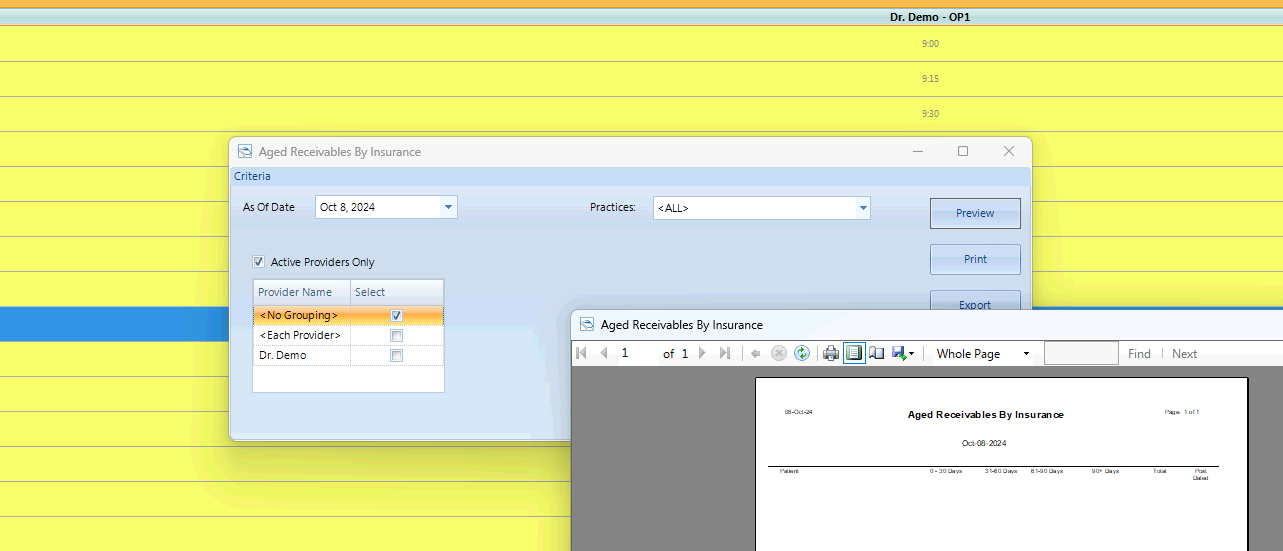
- Go to Reports tab within Tracker and create a copy of each of the Aged Receivables and Aged Receivable by Insurance reports
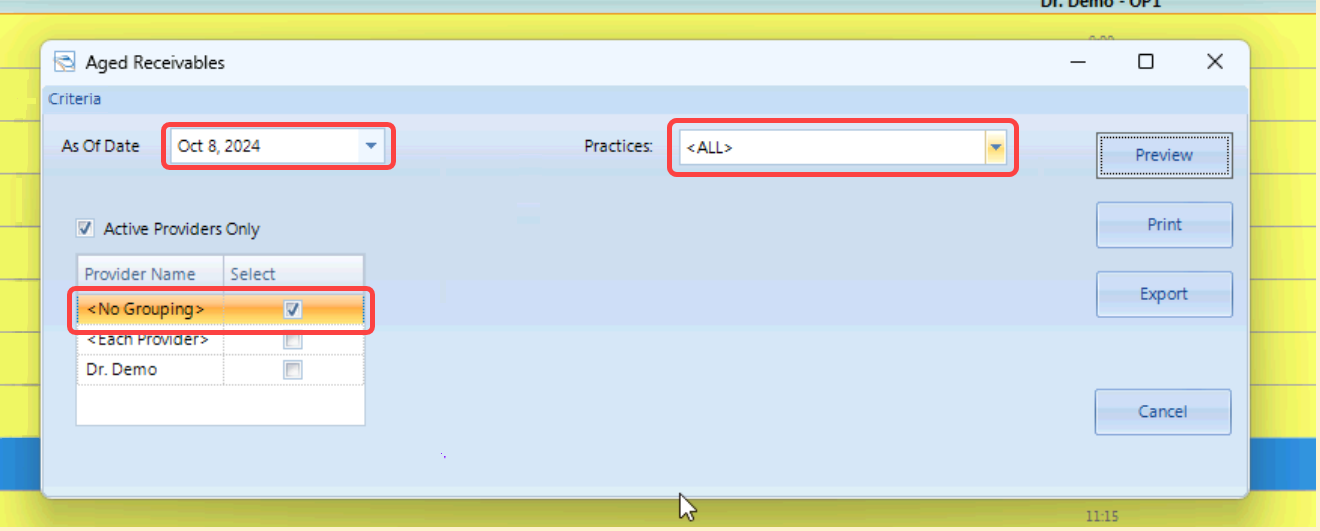
- Select the following values and set each to the same period/metrics as you are looking at in Jarvis:
- As of date
- Select <No Grouping>
- For Practices use the <All> dropdown
- To review the reports, select Preview or Print to view it.
How to read the report: Aging
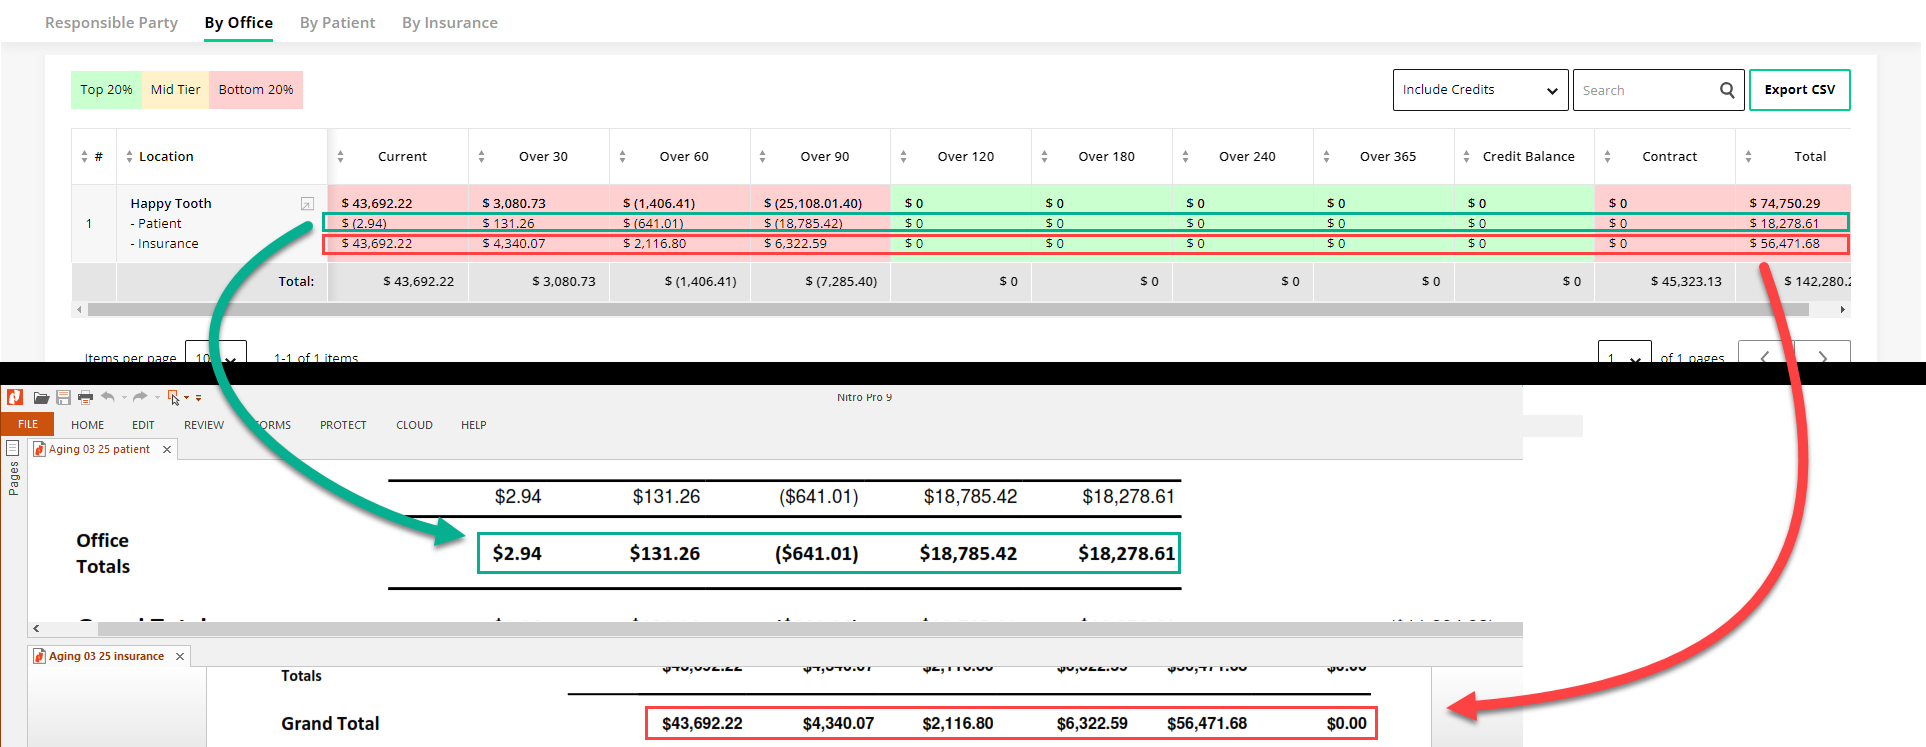
Pulling up the two reports from Tracker, you will be able to see the direct comparison of the two variables as found in the Aging module > By Office view in Jarvis Analytics. The office totals are just the total of the two reports.
Adjustments, Collections, Deposit Slip, Gross and Net Production (Office Total and Provider total)
All of the following metrics can be viewed within one report from within Tracker. The Fees and Payments Summary (by month) report. To create this report, complete the following steps.
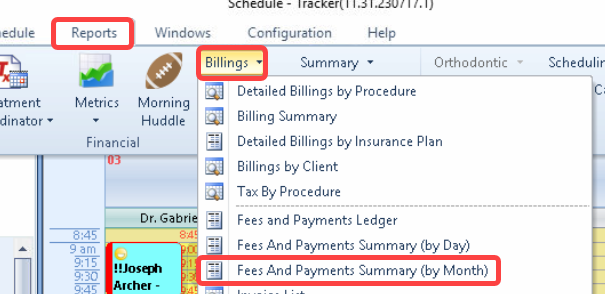
- Go to Reports-> Billings -> Fees And Payments summary (by Month)
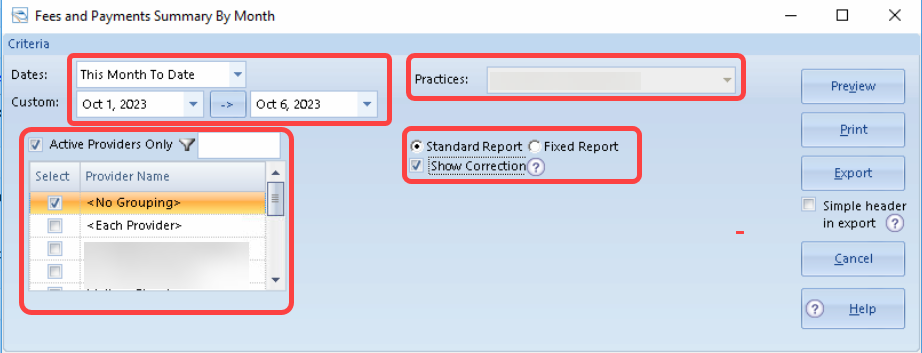
- Set the following metrics in the Tracker report to the same metrics you are looking at in Jarvis Analytics before clicking Print, Preview or Export
- Set Custom date (date to and from)
- Select the same Practice (in case there are multiple offices in one database)
- Select <No grouping> for office totals OR <Each provider> for provider specific total
- Select the Standard report radio button
- Select the Show correction checkmark
- Choose whether to preview or print the report.
- After clicking Preview, a window pops up that will load the report. This may take a moment to load.
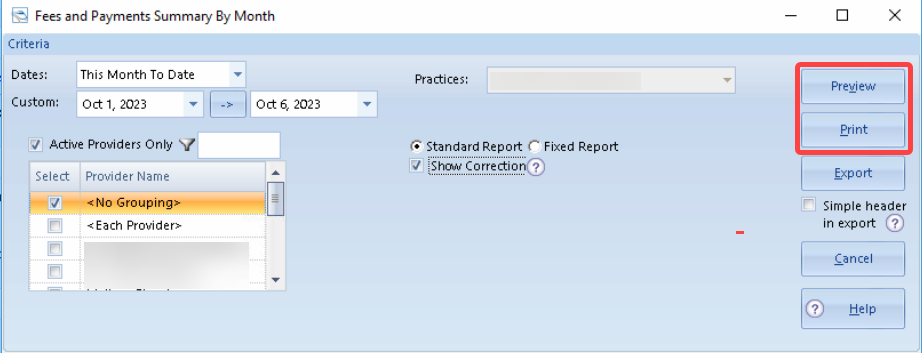
- To print the report, click the Print button and select Print as PDF
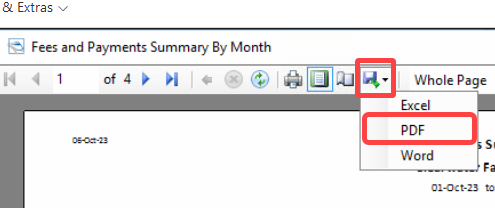
- After clicking Preview, a window pops up that will load the report. This may take a moment to load.
How to Read the Report
As the Fees and Payments Summary (by month) report does not simply display the metrics, use the table below to see how these metrics are calculated and displayed in the Jarvis Dashboard module:
| Fees and Payments Summary Report | Equivalent in Dashboard module |
| Total prod = Fee Amount + Lab + In House + Expense | Total Office Gross Prod |
| Adjustment (this is a negative value) | Total Office Adjustment |
| Total prod + Adjustment (this is a negative value) | Total Office Net Prod |
| Total Payments | Total Office Collection/Deposit Slip |
| Provider Total prod = Fee Amount + Lab + In House + Expense | Provider Gross Prod |
| Provider Adjustment (this is a negative value) | Provider Adjustment |
| Provider Total prod + Adjustment (this is a negative value) | Provider Net Prod |
| Provider Total Payments | Provider Collection |
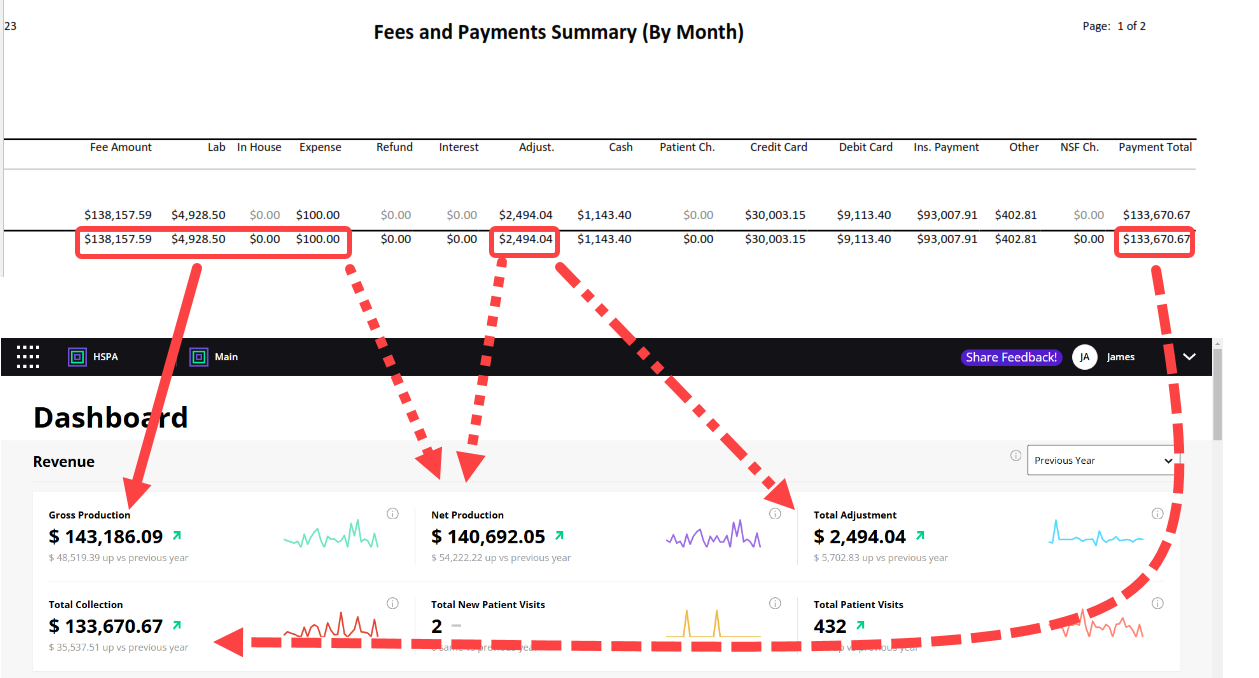
New Patient and Patient Visits (Office Total and Provider total)
To look at your new and existing patient visits, you will need to create the Appointment list by Date report. Use the following steps:
- To print this report, go to Schedule-> Reports -> Appointment List by Date
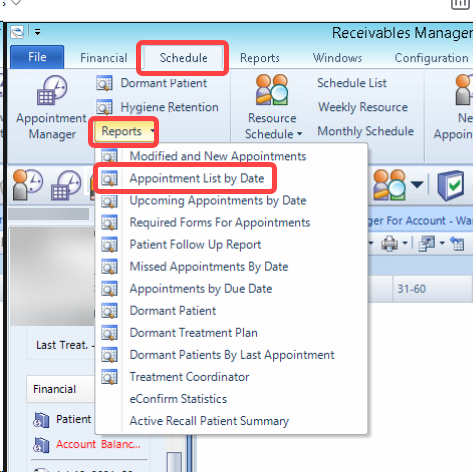
- After opening the report creator, select the following and then click the Search button:
- Date Range
- Select either no grouping (for office totals) or each provider (for provider totals)
- Once the information populates, you can export the report to Excel.
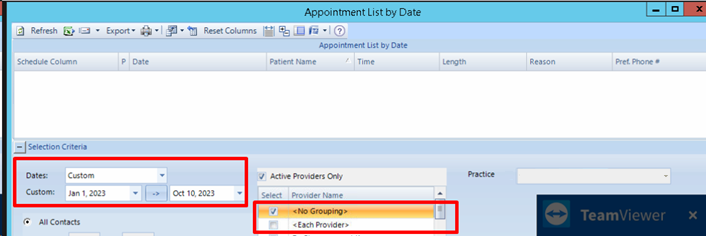
How to print report
- After the report is generated, select the “Export to Excel” Button

- Name the file and click Save
How to read the Appointment list by Date report for Patient Visits
Open the report and the first thing you can see is the total for patient visits. Appointment Status (Booked) = Patient visits. This should match with your Total Patient Visits within the Dashboard module.

How to Read the Appointment list by Date report for New Patients
For New patients it will require using the Filter tool within Excel.
- First, click the filter tool in Excel
- Click the the Reason column header,
- Select the check marks for NP, and NP HYG checkmarks to filter out just the New Patients.
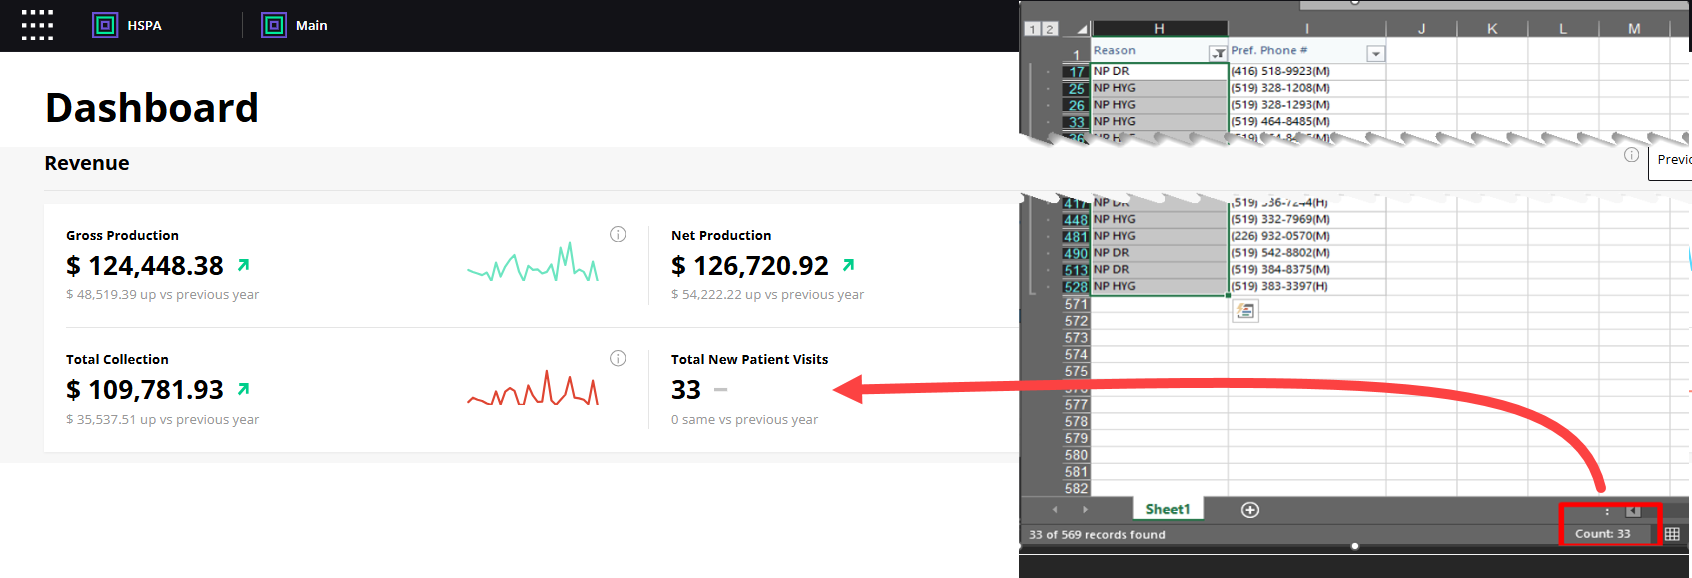
- Count the NP and NP Hyg rows that remain. This is your new patient count.
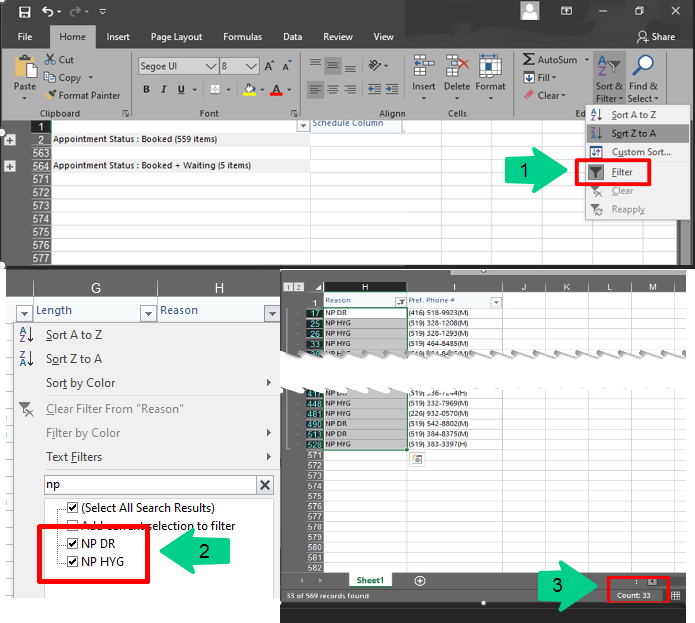
- You can find the comparable data within the Dashboard module in Jarvis Analytics.
